Description
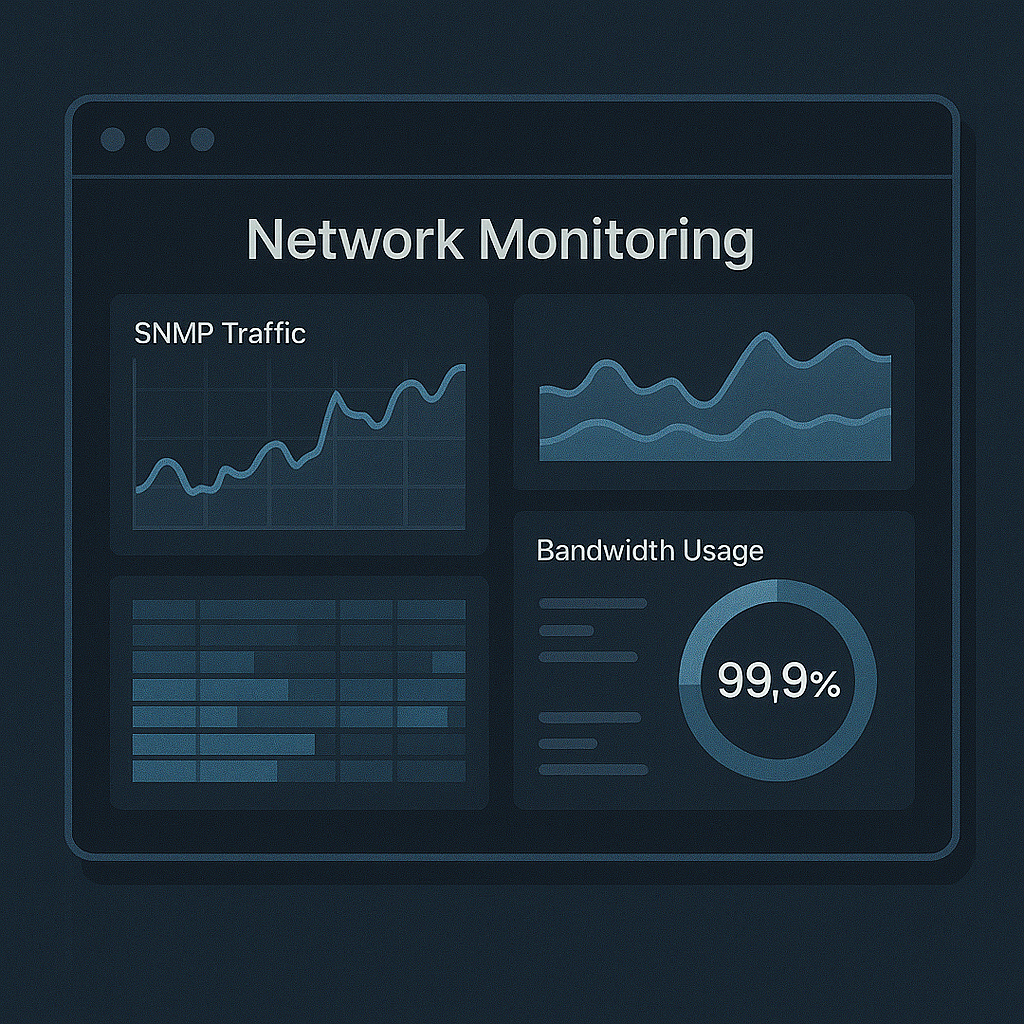
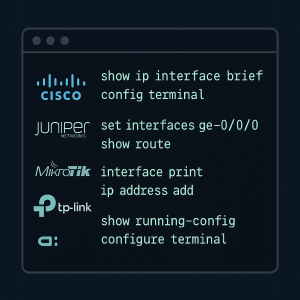
Deploy professional-grade network observability in under an hour. This kit includes pre-configured Grafana and Prometheus dashboards, Zabbix templates, SNMP pollers, and customizable alerting rules for CPU, memory, bandwidth, jitter, and packet loss. Supports multi-vendor device tracking and multi-tenant views. Also includes JSON import files, log parsers, and alert integrations with Slack, Telegram, and Teams. Fully scalable to MSP-level infrastructure.
Reviews
There are no reviews yet.